In the last post, we introduced the concept of a Sales Learning Curve. We also defined Product/Market fit for enterprise SaaS startups through the lens of a set of metrics and criteria called the Minimum Viable Metrics for PMF. Now that we are aligned on a starting point for the Hypergrowth Sales Playbook, let’s get an idea of what we are thriving towards. In this post we will take a look at what Go-To-Market fit looks like, how to get there and introduce a second set of metrics and criteria: Minimum Viable Metrics for GTM fit.
What Go-To-Market fit looks like
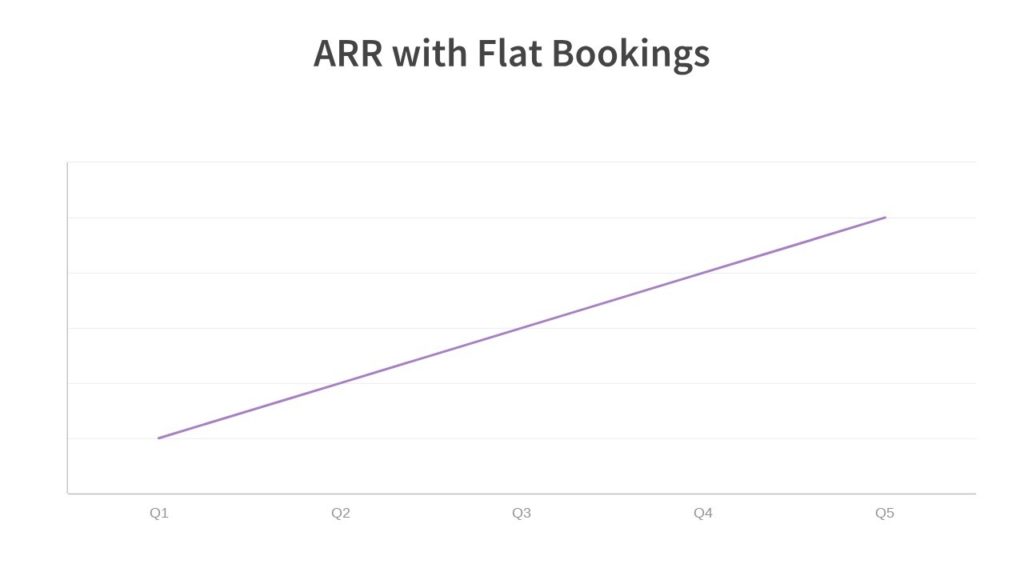
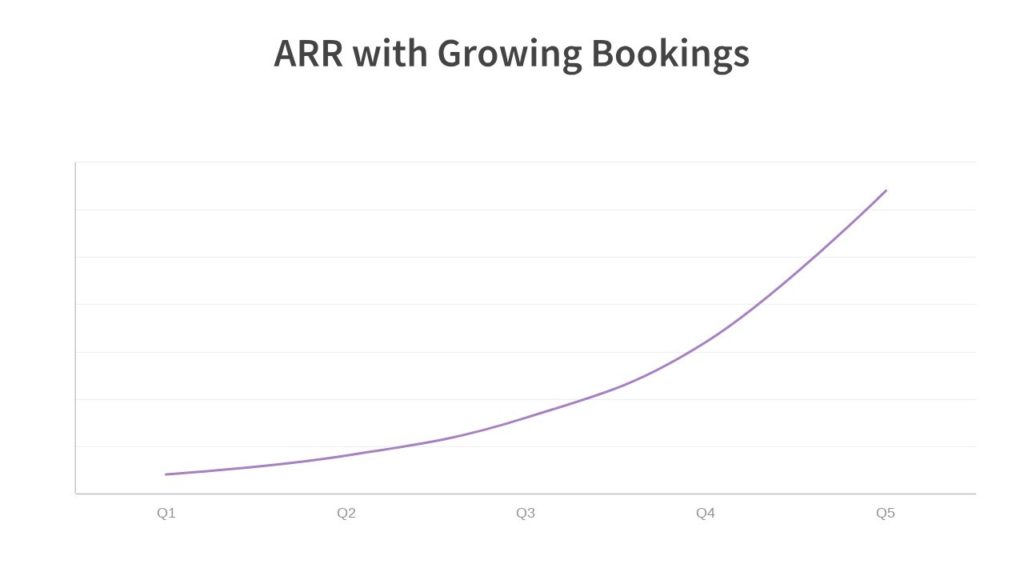
As previously noted, while Product/Market fit is often sufficient to unlock growth for consumer startups, there is an intermediate step required for enterprise startups. We call that step Go-To-Market fit – a term first introduced by Bob Tinker and Tae Hea Nahm. Enterprise startups need to land on a model that is scalable, repeatable and cash-efficient before investing aggressively in growth. Reaching Go-To-Market fit for a given product and market means that you can reliably and predictably generate growth in Bookings. In SaaS, this equates to a growing Net New ARR.
Net New ARR = New ARR + Expansion ARR – Churned ARR
It is growth in Net New ARR that generates the exponential shape of an ARR curve that constitutes the basis of Hypergrowth.


How you get there
Looking at the definition above it is clear that growing Net New ARR will come from a combination of increasing new ARR (new customers) and improving Net Negative Churn – where expansion revenue from existing customers outweighs lost revenue from existing customers.
Achieving this for a given market and product means that you know where and how to find new customers, how to win them over in a reasonable amount of time, what kind of value you are creating and how to provide it to them in such a way that they are so delighted that they renew and potentially increase their investment with you. Which brings us back to our Revenue Growth equation introduced in a previous post:

As mentioned, in order to execute on this from a Sales perspective you also need to know your ideal rep profile, how to hire them, how to coach and train reps to ramp in a reasonable amount of time, how to get a good portion of them from productivity to consistent quota attainment and finally how to keep voluntary attrition low and build a development process so that consistent performers get promoted to roles that challenge them with more responsibility. People growth equation:

Minimum Viable Metrics for GTM fit
Now that we have identified the underlying factors that drive growth, let’s see what good look like.
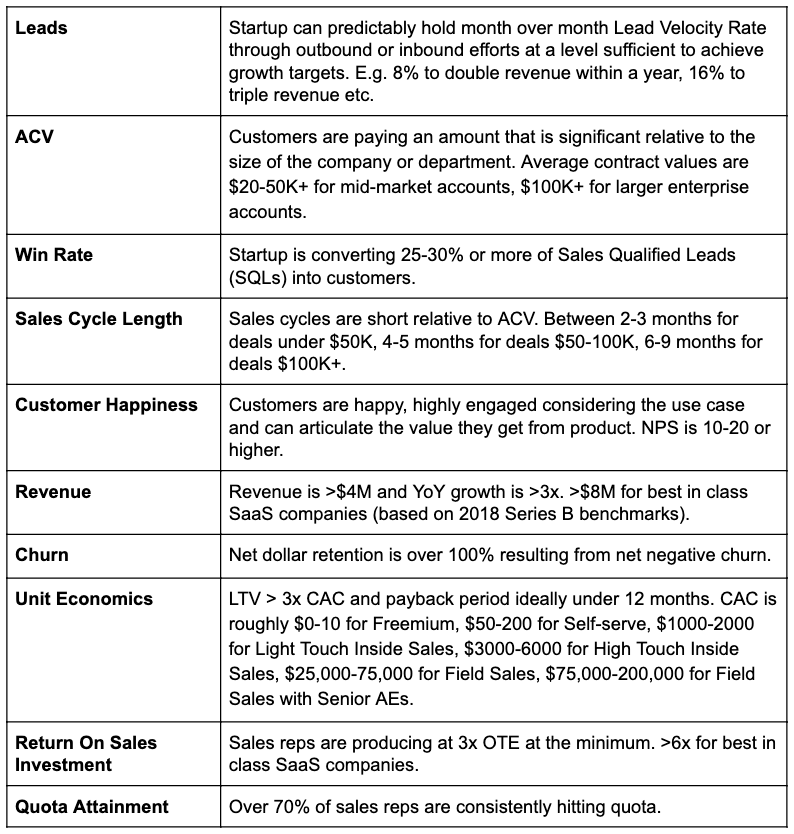
Just as we have done for Product/Market fit, we will introduce a set of metrics and criteria to measure the degree of Go-To-Market fit for an enterprise SaaS startup: Minimum Viable Metrics for GTM fit. These will act as exit milestones for the Transition phase highlighted in the Sales Learning Curve. Note the inclusion of Unit Economics and Sales Productivity metrics to measure the viability of a growth model. Here also, these metrics and criteria are not meant as a binary test, but looked at together provide a good picture of how close an enterprise SaaS startup is to unlocking growth.

By the time an enterprise SaaS startup reaches these metrics, they should have a clear view of the end-to-end Customer Journey and a validated Go-To-Market model along with battle-tested playbooks and tools developed along the way. At the very minimum: a Lead Generation Playbook, Sales Playbook, Customer Success Playbook, Sales Enablement tools for new reps and Onboarding and Training tools for new customers. All of these topics will be addressed as part of the overall Hypergrowth Sales Playbook.
Thank you for reading. In the next post will will look at the first step in the playbook: picking your best potential target market.


