

Now that I have introduced the Hypergrowth Sales Playbook and why, in my humble opinion, more Sales and Go-to-Market focused playbooks should exist out there (and be shared!) I wanted to highlight the logic and approach behind it.
There is no shortage of frameworks and benchmarks used by entrepreneurs and VCs to assess the fundamentals of a SaaS startup. Whether you are looking at a SaaS Quick Ratio or LTV/CAC ratio, the 40% Rule, G.R.I.T. framework or benchmarking against T2D3 they all essentially boil down to growing rapidly and cash efficiently while keeping churn low.
A few years ago Tom Tunguz wrote a post about Sales Velocity, an equation that originates from operations research and the work of Charles Babbage and Georges Doriot among others. It inspired me to think about how the concept could apply to revenue growth in a broader sense but specifically for an Enterprise SaaS startup. I wanted to adapt the concept into a simple visualization of the key drivers of growth in such a way that solving for growth was equivalent to solving components of an equation.

The first part of the equation represents revenue from new customers and the second part from existing customers. Now looking at the key variables that affect each part of the formula above we can focus on the equation below. I am adding operators not in an algebraic sense but to highlight how a variable affects growth.

Let’s unpack this first in case you are not familiar with some of the terms.
LVR stands for Lead Velocity Rate. It a measures of the rate at which pipeline is created by looking at the percentage growth in qualified leads month over month. Holding everything else equal, you if are growing LVR by 10% month over month, revenue will also increase 10% after an average sales cycle length. So (again, holding everything else equal) you should plan for an LVR of 8% if you are looking to double revenue within a year, 16% to triple revenue etc.
Win Rate measures the percentage of opportunities won over a given period. Note that this is different from a Close Rate which is a measure of how many opportunities closed during a given period compared to how many new opportunities were created during that same time frame. For the purposes of this equation, we will leave the Win Rate as the controlling measure of success but as a rule of thumb use Close Rate when your opportunity qualification criteria are really buttoned up and Win Rate when you have a process to keep the pipeline squeaky clean.
ACV stands for Annual Contract Value and is the average annualized revenue per customer contract.
Sales Cycle length measures the amount of time from your first touch with a prospect to closing the deal, averaged across all won deals.
Net Revenue Churn is the percentage of revenue you have lost from existing customers in a period. Net Negative Churn (which is very positive!) occurs when expansion revenue from existing customers totals more than lost revenue from existing customers.
Finally, Time to Value is the amount of time it takes a new customer to realize value from your product. This is obviously trickier to measure as it depends on several factors such as onboarding, training, product complexity and the type of value your solution delivers but it is a crucial metric for Customer Success. The sooner a new customer can get value from your offering, the more likely they are to renew and expand.
Now that we have defined the terms, solving this equation (left to right) for a given market and product means that you know where and how to find new customers, how to win them over in a reasonable amount of time, what kind of value you are creating and how to provide it to them in such a way that they are so delighted that they renew and potentially increase their investment with you. If you do this well, the neat thing is that you will build a brand name for yourself and start to generate organic interest that will compound your growth to new heights. Another positive byproduct is that the quicker you go through this process, the more your feedback loop shortens and the more you learn to sell more, better, faster.
The equation is laid out in such a way that it highlights what should come first or what you have the most control over. As a result, solving this equation left to right also generates a revenue growth playbook and the sequence and elements that come with it. You have reached Go-To-Market fit for a given market and product if you have figured out a way to hit what we will call the Minimum Viable Metrics – metrics that are good enough for you to have a growth model that is scalable, repeatable and cash efficient. You get there by running experiments on portions of your growth model, testing assumptions, building and validating your Sales, Marketing and Customer Success process through customer interactions and iterations.
Once you have reached Go-To-Market fit, accelerating sales and generating future growth boils down to either optimizing the model and generating better metrics (by figuring out how to improve elements in the numerator and decrease elements in the denominator) or solving a new equation for a new market and/or product.
Finally, the Revenue Growth equation also inspired me to think about how the concept could apply to People. The model would break if you don’t have the right talent involved in the first place. I won’t go into much detail for the People Growth equation as the terms used are well known and it mirrors the previous equation in spirit. I will use a Sales specific example here but you could likely find a way to adapt it to other functions:
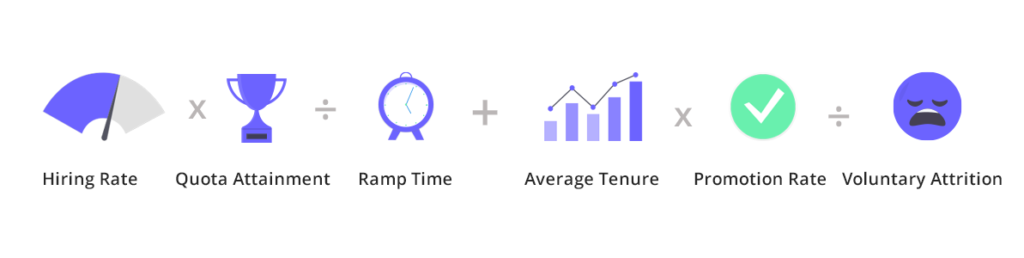
Solving this equation also generates elements of a playbook. It means that you know your ideal rep profile, how to hire them (whether externally or through an internal SDR career path), how to coach and train reps to ramp in a reasonable amount of time, how to get a good portion of them from productivity to consistent quota attainment and finally how to keep voluntary attrition low and build a development process so that consistent performers get promoted to roles that challenge them with more responsibility. Here again, do this well and you will have generated some goodwill in the form of an employer brand and sales culture that makes it easier to recruit. Fail to do this well and moral will suffer, top performers will look elsewhere and growth will start to stall.
If the last few paragraphs don’t make a ton of sense yet, not to worry – there is a lot to unpack. Over the next blog posts I will expand on what I mean by all this but in the meantime here is a link to the Hypergrowth Sales Playbook resulting from solving both equations. Think of it as a roadmap for this blog, a table of contents if you will for future posts that I will write as time permits. I hope you find these visualizations helpful. Would love to hear your thoughts on the approach and elements you think I might have missed or ways to improve the model.
Thank you for reading.