Over the past few weeks, you ran an initial assessment to gauge whether you are ready to embark on your search for Go-To-Market fit. You reverse engineered your next round to get a clear picture of the metrics and milestones to thrive towards. You were introduced to a conceptual framework to help break down the different components of a successful Go-To-Market. You identified your best potential target market and validated that it will be the focus on your search for Go-to-Market fit. You profiled your ideal customer and put together version one of your Buyer’s Journey. You are now ready to complete the final step in our Getting Started section: building out an outline of the Go-To-Market model you will be testing over the next several weeks.
As mentioned in a previous post, while you get to decide on a set of customers to focus on, you don’t really get to decide how to market and sell your products. To a large extent, your customers already buy a certain way and will determine your Go-To-Market model. While you can certainly get inspired by Atlassian, Slack, Twilio and others, you can’t just adopt their business model without taking into account your customer, product and market context.
Go-To-Market models and customer acquisition strategies abound. As you move from a less complex to a more complex sales cycle, the model typically evolves to one or a combination of the following:

The trick when it comes to finding Go-To-Market fit is to pick one – and only one – model to test out. Early stage startups don’t have the resources to support multiple models simultaneously. You need focus, measurability and repeatability in order to the generate learnings necessary for scale. So the question is: how do you know which Go-To-Market model to test out? Fortunately, the work you have put in to-date will help answer that question. And here again, Mark Leslie has developed a neat framework to help you pick an appropriate Go-To-Market model.
Leslie’s Compass: A Framework For Go-To-Market Strategy
When I talk to founders, there is often a misconception that having a GTM strategy means having a good Powerpoint pitch and a handful of sales and marketing tactics. It is so much more than that. At the highest level all Go-To-Market models are about figuring out how to find customers and move them through the buying journey, identifying what’s working and what’s not, and how you eventually convince them to buy, onboard etc. In order to do this, you need to take a close look at the interplay between Sales and Marketing. At its core, Leslie’s Compass is a conceptual framework that helps exhibit that interplay. I will highlight the key concepts here but would strongly suggest reading Mark Leslie’s entire post on the subject.
There are typically two key muscles you can flex to take a product to market: Marketing and Sales. You first need to identify whether you are in a Sales lead or Marketing lead model. The less marketing is flexed to bring a product to market, the more sales must step in and vice versa.

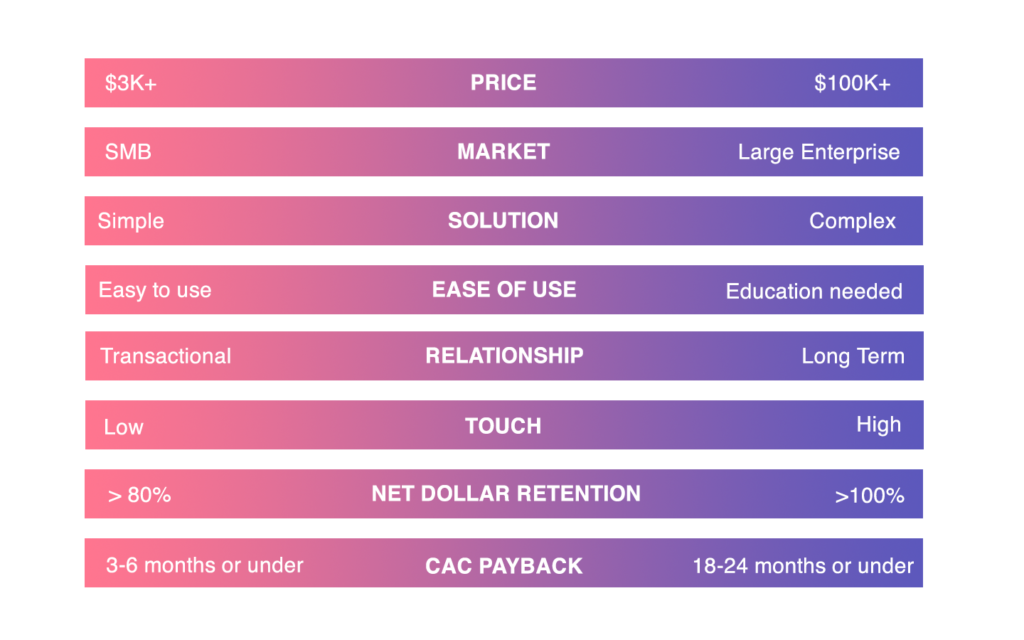
You determine where you stand on the Sales/Marketing spectrum by pinpointing where your solution stands on seven key variables: Price, Market, Complexity, Ease of Use, Type of Customer, Customer Lifetime and Level of Customer Engagement. For our purposes I will add Churn and CAC Payback period as two additional variables since we are looking predominantly at Enterprise SaaS. To get there, ask yourself the following questions about each variable:
- Is this a large or small economic decision for the buyer?
- Is it easier for them to find you or for you to find them?
- Can a customer self-serve to use or is education required?
- After all is designed, done and shipped, is there still much more for the consumer to do?
- Are you predominately selling directly to people or companies?
- Do you measure successful customer relationships by transactions or longevity?
- How much agency do you have in developing your relationship with your customer? Can your efforts compound or are they mostly one-off?
- How long will it take you to recover your customer acquisition costs?
- What percentage of revenue have you lost from existing customers over the last months/year?
The good news is, you already have all the answers to these questions. Go back to the work you did to pick an ideal target market and version one of your ICP and Buyer’s Journey. The key as you answer these questions is less to identify your startup’s exact point on the spectrum, but more to know which approach to follow or in which half of the diagram your startup is positioned.

According to Leslie, the general idea is this:
There are exceptions but, by and large, how successful a go-to-market strategy depends on how reasonably aligned each factor is in the same half of the diagram.
Everything doesn’t need to neatly align on one side of the chart for a successful Go-To-Market strategy. However, you need to be aware of the points of misalignment to make adjustments. This is where Product can also play a role. E.g. by addressing Ease of Use or by working on a Product Qualified Leads strategy – more on this in a future post.
Zoom Example
Here is an example of what this looks like. Let’s take Zoom as a use case, looking at their recently filed S1.
Zoom recently filed for IPO after growing from $61M to $331M in the past three years. The company offers video, voice, chat, and content sharing across devices and locations. Zoom developed proprietary tech optimized for the cloud that separates content processing from the transporting and mixing of streams. Engineers release 200+ new and enhanced features per year. They have 50,800 customers with more than 10 employees representing 78% of revenue with 344 customers paying more than $100K. Multi-year contracts represent 74% of ARR. The average ACV is $5K. The average term for multi-year contracts is 2.4 years. Zoom has a flywheel sales model with self-serve, inside-sales, resellers and strategic partners. 55% of their 344 $100K+ revenue customers in FY’19 started with at least one single free host. CAC payback period is 9 months. Net dollar retention is 140% annually.

As you can see, most variables align on the left side of the spectrum for Zoom (good sign). In this case it is a Marketing lead model where the Growth team has a huge role to play as evidenced by the flywheel and seeding strategy. Solution Complexity aside, the fact that Zoom has stellar Net Dollar Retention at 140% and is able to get customers to commit long term is actually very positive even if those variables are on the right side (better sign). This very efficient model is what helped Zoom get to 1.8 Sales Efficiency in FY’19 – meaning one dollar of their sales and marketing spend results in $1.80 of gross profit!
This is an example of a company with a mature Go-To-Market model and, admittedly, I am over-simplifying since Zoom deploys multiple models depending on the market/product/channel etc. When you plot the Leslie Compass for yourself, however, just remember that when most variables align on the left you are likely in Marketing lead model. When variables align on the right of the chart Sales should lead the Go-To-Market strategy. And when you have variables that are misaligned, look into them very closely. It doesn’t necessarily mean that something is wrong – look at Zoom! – but in most cases it does…
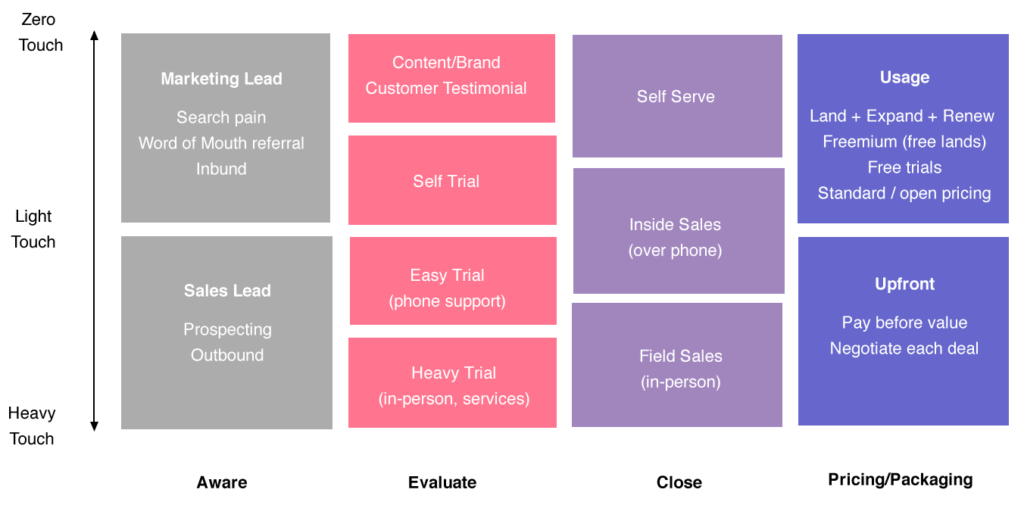
Once you have plotted your initial Go-To-Market model assumption on the chart, you can orient yourself using the figure below adapted from Bob Tinker and Tae Hea Nahm. Think of it as a representation of the likely paths you will take in B2B SaaS.

This concludes our Getting Started section. You are now ready to break down your Go-To-Market model assumption into different components that will help validate and build your overall playbook. First up: building predictable pipeline generation.
Thanks for reading.


